Apple Holds 54% of the US Smartphone Market as Samsung Climbs to 30%
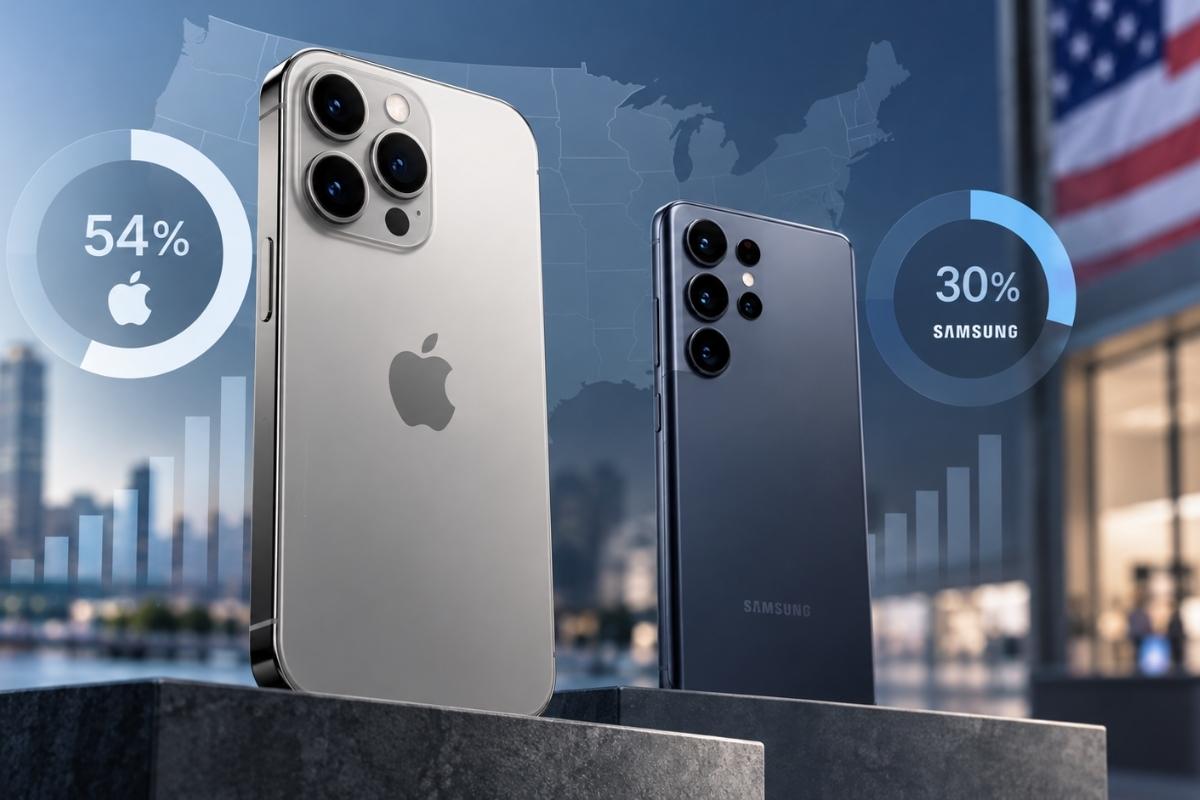
Apple captured 54% of U.S. smartphone shipments in Q2 2026. Samsung reached 30%.
Put those two numbers together and roughly 84% of smartphones shipped during the quarter carried either an Apple or Samsung logo, allowing for rounding. Everyone else is fighting over what is rapidly starting to look like the leftovers.
Apple still has a huge advantage. A 24-percentage-point gap is not Samsung breathing down Apple’s neck. It is Samsung shouting across a fairly large room.
Still, Samsung’s 30% deserves attention.
Samsung held 27% of U.S. shipments in Q2 2025 and 26% in Q1 2026. Its Q2 2026 result therefore represents a gain of three percentage points year over year and four points compared with the previous quarter.
So Apple is not collapsing. Samsung is simply getting bigger. One cannot help but ask, where are all those extra Samsung phones coming from?
Samsung Is Climbing, but Apple Is Not Collapsing
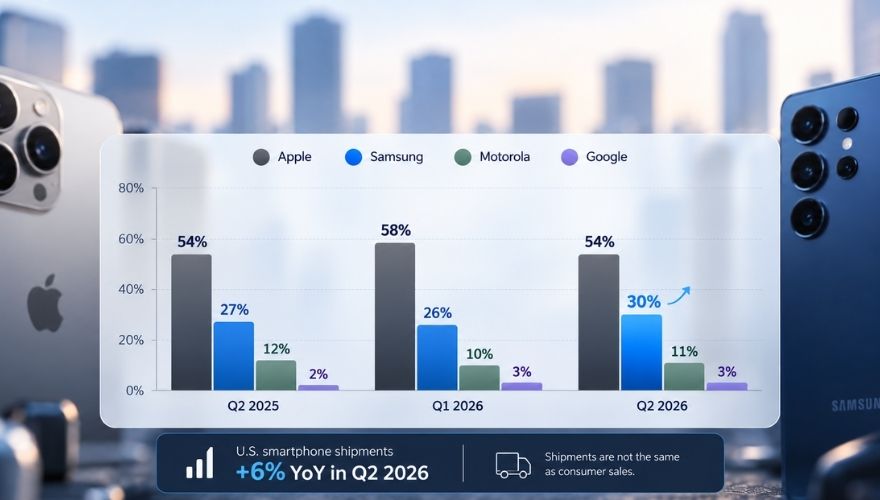
Quarterly comparisons make Samsung’s progress look interesting without turning it into something larger than it is:
| U.S. shipment share | Q2 2025 | Q1 2026 | Q2 2026 |
| Apple | 54% | 58% | 54% |
| Samsung | 27% | 26% | 30% |
| Motorola | 12% | 10% | 11% |
| 2% | 3% | 3% |
U.S. smartphone shipments increased 6% year over year in Q2 2026 as manufacturers pushed more inventory into sales channels ahead of expected RAM and NAND price increases.
Later consumer-sales numbers tell a less cheerful story. That difference matters. A phone shipped to a carrier warehouse is not automatically a phone somebody bought. Smartphone statistics have apparently decided they also need fine print.
Its three-point annual gain matters because U.S. smartphone market share usually moves slowly among established brands. A company does not casually add several percentage points in a market measured in tens of millions of devices.
Still, calling this an iPhone retreat would be difficult.
Apple briefly climbed to 58% in Q1 before returning to 54%. Quarterly swings happen because of launch schedules, promotions, carrier activity, inventory changes, and ordinary buying cycles.
Samsung’s result looks more like competitive improvement combined with consolidation among fewer manufacturers.
30% sounds much more threatening until you look across the table and discover Apple has barely moved.
We Have Seen a Very Similar Rivalry Before
Back in March 2023, Apple held more than 55% of the U.S. smartphone market while Samsung sat slightly above 29%.
Q2 2026 shipment figures put Apple at 54% and Samsung at 30%.
Three years passed, several generations of iPhones and Galaxy devices arrived, artificial intelligence invaded every product presentation available, and America ended up with almost the same split.
Longer-term history tells a more dramatic story.
Samsung held only about 9.12% of the U.S. smartphone market in 2011. Apple was already around 54%.
Samsung therefore spent much of the following decade turning itself into the only manufacturer operating anywhere near Apple’s scale in America.
Getting to 30% was a major climb and, without a doubt, getting much further may be harder.
Samsung spent years climbing the mountain. Slightly inconvenient for Samsung, Apple appears to have built a house near the top.
America Looks Very Different Compared With Global Smartphone Sales
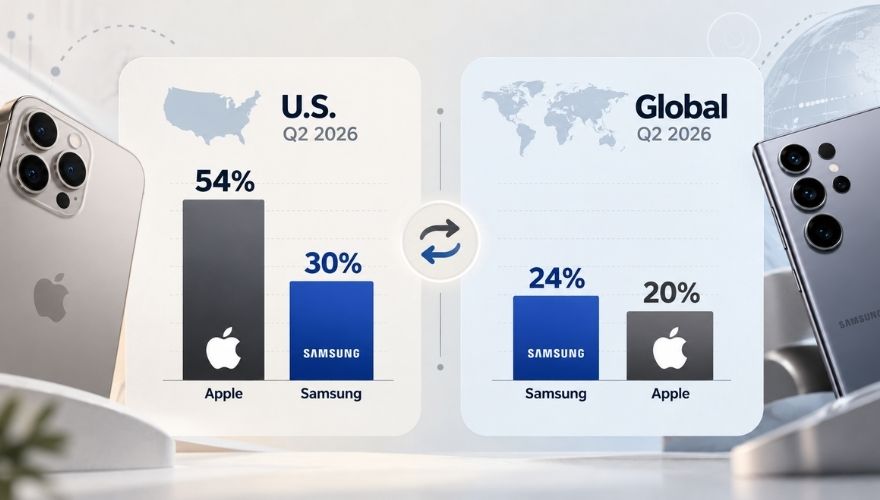
U.S. numbers can create a distorted picture if they are treated as worldwide figures.
Apple held 54% of U.S. smartphone shipments in Q2 2026. Samsung held 30%.
Globally, Samsung led with 24% during the same quarter, while Apple held 20%.
That is almost a reversal.
Samsung also returned to the worldwide No. 1 position after Apple had moved ahead earlier in 2026. Strong Galaxy S26 demand, especially around the Galaxy S26 Ultra, helped Samsung’s performance.
Apple still recorded 3% year-over-year shipment growth worldwide and reached a record 20% share for a second quarter.
None of those figures contradict Apple’s 54% U.S. number. They measure different markets.
A 54% share does not mean more than half of every smartphone sold across Earth carries an Apple logo. It refers specifically to U.S. shipment share during Q2 2026.
Take Apple’s 54% outside America and the number immediately begins losing limbs.
Geography matters enormously in smartphones.
Pricing, carrier promotions, local brands, financing habits, operating-system preferences, and retail networks all change across countries.
Samsung Can Attack at Both Ends of the Price Range
Samsung has one advantage Apple cannot easily copy without changing its product lineup. Galaxy phones cover a huge range of prices.
At the expensive end sits the Galaxy S26 family, including the S26 Ultra. Strong demand for those devices helped Samsung internationally and gave it a serious product against premium iPhones.
At the cheaper end, Samsung has its Galaxy A-series.
Large volumes of Galaxy A17 5G devices were shipped ahead of expected memory-price increases, helping Samsung gain additional U.S. volume. Samsung also benefited in prepaid channels as lower-priced competitors struggled.
That gives Samsung two very different routes into the same market.
Galaxy S phones can compete with expensive iPhones. Galaxy A phones can target buyers who are nowhere near a four-figure smartphone budget.
Older iPhones and occasional discounted models give Apple some lower-priced options, but Apple does not operate a broad budget lineup comparable with Samsung’s A-series.
Samsung can chase someone considering a $1,000 phone and someone watching every dollar in the same shopping category.
Very few smartphone makers can do both at serious scale.
Cheap Smartphones Are Getting Crushed
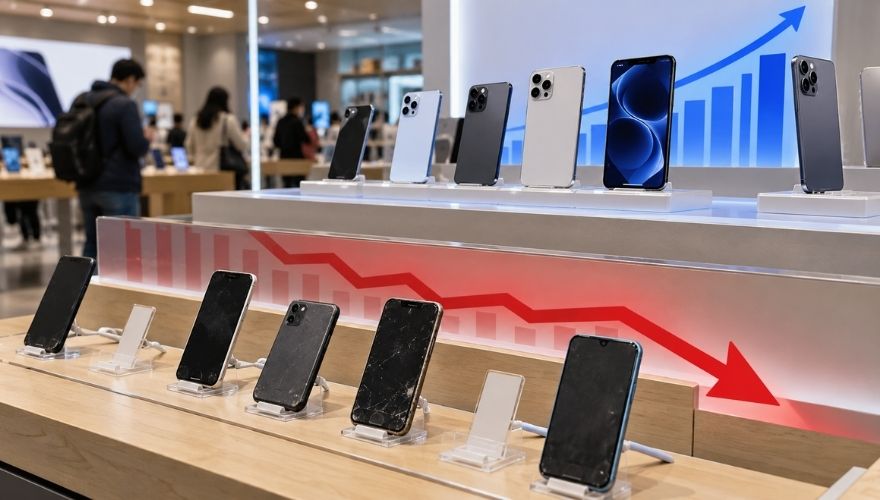
Overall U.S. smartphone sales declined 5% year over year in Q2 2026. Numbers lower down the market are much uglier.
Sales among manufacturers outside the four biggest brands dropped 45%. Smartphone sales below $100 collapsed 64%.
Apparently the technology industry looked at affordable pricing and decided it had enjoyed enough of that.
Rising memory and storage costs are making extremely cheap smartphones harder to sell at acceptable margins.
Smaller manufacturers usually have less room to absorb those increases.
Samsung operates under very different economics.
Its size, supplier relationships, manufacturing volume, carrier presence, brand recognition, and wide product catalog give it more options when component prices move against the industry.
Samsung also does not need every extra percentage point to come directly at Apple’s expense.
Some growth can come as weaker manufacturers lose buyers.
Motorola still held 11% of U.S. shipments in Q2 2026. Google held 3%. Both have meaningful positions, but neither operates anywhere near Samsung’s 30%.
Apple Has 155 Million Reasons Switching Can Be Difficult
Apple’s position becomes easier to appreciate once installed users enter the picture.
Roughly 155 million people in the U.S. were using iPhones in 2024, with adoption especially strong among younger Americans.
Younger users make Apple’s position look even harder to disturb. Piper Sandler’s fall 2025 survey of 10,969 U.S. teens found that 87% already owned an iPhone.
Apple is not waiting for those buyers to develop brand habits in adulthood. A lot of them are getting started before they can legally rent a car.
Furthermore, plenty of iPhone owners also use products like:
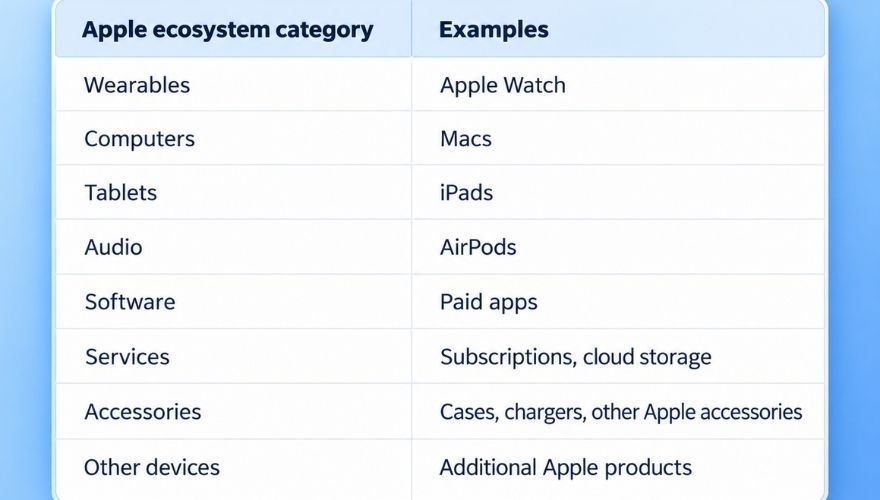
Scale matters here too. Apple reported more than 2.5 billion active devices worldwide in January 2026 across its product categories.
That figure does not tell us how many American iPhone owners also have a Mac or Apple Watch. It does show how enormous the wider hardware base has become.
Samsung is competing with a phone, but in plenty of households it is also competing with everything already talking to that phone.
Buying behavior gives that switching friction some numerical weight. Among U.S. iPhone owners who bought another smartphone, 89% chose another iPhone during CIRP’s measured 12-month period. Loyalty had previously reached 94%.
Samsung is not trying to win over a customer base casually browsing both operating systems every upgrade cycle. A large majority of iPhone owners simply buy another iPhone.
In many cases, it needs to persuade that person that changing phones is worth rearranging several other things already working perfectly well. Still, switching friction gives Apple something valuable.
Every satisfied iPhone owner is not starting each upgrade decision with a completely empty shopping list.
Closing Thoughts
Apple already controls more than half of U.S. smartphone shipments.
That could eventually produce a market in which Apple dominates much of the premium segment while Samsung becomes the default alternative across several price brackets.
Nothing guarantees that outcome.
Smartphone markets can change quickly when a new form factor, pricing shift, carrier policy, component shortage, or genuinely useful product feature arrives.
Still, consolidation is difficult to ignore.
Figures reflect the sources and time periods cited in this story. It is general information, not financial or investment advice.