How Much Americans Pay for Home Internet in 2026, From the Cheapest State to the Priciest
Americans pay an average of $81.16 per month for home internet in 2026, but that number hides a pretty ridiculous geographic price gap.
New Jersey residents have access to plans averaging $65.43 per month, while Alaska tops the national rankings at $109.88. That is a difference of $44.45 every month, or $533.40 over a full year.
Apparently, internet providers never received the memo that accessing the same global network shouldn’t require wildly different household budgets.
Annual internet plan costs average approximately $973 nationwide, yet individual states tell very different stories. Some enjoy lower prices thanks to dense infrastructure and competing providers. Others face higher costs associated with remote locations, expensive networks, and limited alternatives.
So, what does the FK average internet bill actually reveal about internet affordability across America? Quite a lot, especially once connection speeds enter the conversation.
The Cheapest States for Home Internet in 2026
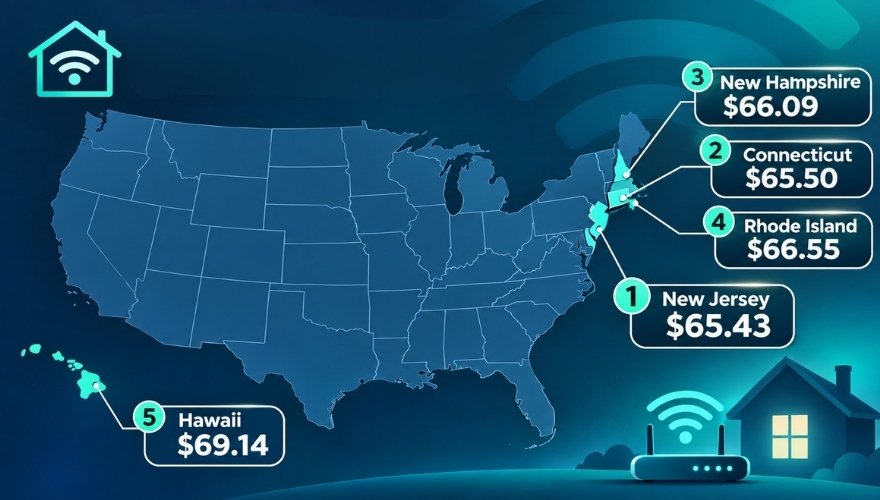
New Jersey takes first place as America’s cheapest state for home internet, averaging just $65.43 per month.
Connecticut follows almost identically at $65.50, while New Hampshire, Rhode Island, and Hawaii complete the five most affordable states.
| Rank | State | Monthly Cost |
|---|---|---|
| 1 | New Jersey | $65.43 |
| 2 | Connecticut | $65.50 |
| 3 | New Hampshire | $66.09 |
| 4 | Rhode Island | $66.55 |
| 5 | Hawaii | $69.14 |
New Jersey’s average is $15.73 below the national figure, giving residents an annual price advantage of $188.76 compared with the nationwide benchmark.
Four of America’s five cheapest states are concentrated in the Northeast. That geographic pattern makes sense when considering population density, established broadband infrastructure, and opportunities for providers to compete within relatively compact markets.
Hawaii is the interesting exception.
Despite its geographic isolation and the costs associated with connecting islands, Hawaii records an average monthly price of $69.14, placing it fifth nationally.
Affordable pricing, however, doesn’t automatically guarantee impressive performance. A relatively inexpensive connection delivering slow download speeds could offer worse value than a slightly more expensive fiber plan.
The Most Expensive States for Home Internet in 2026
Alaska occupies the opposite end of the rankings, with an average monthly internet price of $109.88.
Iowa follows at $93.15, while Nevada, Georgia, and North Dakota complete the five most expensive states.
| Rank | State | Monthly Cost |
|---|---|---|
| 1 | Alaska | $109.88 |
| 2 | Iowa | $93.15 |
| 3 | Nevada | $89.12 |
| 4 | Georgia | $88.35 |
| 5 | North Dakota | $87.71 |
Alaska’s average annualized internet cost reaches $1,318.56, compared with just $785.16 in New Jersey.
Even Iowa, America’s second-most expensive state, averages $16.73 less per month than Alaska.
Alaska isn’t merely leading the expensive-internet rankings. It has opened a rather comfortable lead over everyone else.
Geography offers part of the explanation. Connecting households across remote communities, difficult terrain, and vast distances can require substantial infrastructure spending.
Lower population density also means providers have fewer customers available to recover those investments.
However, geography cannot explain every expensive internet bill. Georgia and Nevada demonstrate that higher average prices aren’t restricted to America’s most remote states.
Limited competition can also leave households paying more without receiving noticeably better connections.
Cheaper Internet Doesn’t Always Mean Better Value
Monthly prices tell only half the story. Connection speed determines how much internet performance consumers actually receive for their money.
A separate October 2026 analysis compared average monthly payments with median download speeds to calculate the cost per megabit per second (Mbps).
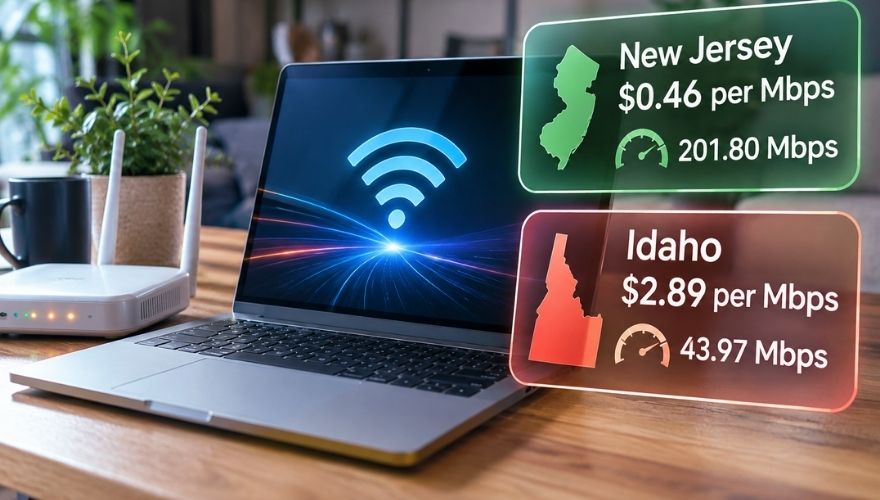
New Jersey once again finished first, with a cost of just $0.46 per Mbps.
Florida followed at $0.47, while Delaware and Maryland each recorded $0.48.
Idaho produced a considerably less impressive result.
At $2.89 per Mbps, Idaho’s internet costs approximately 6.3 times as much per unit of download speed as New Jersey’s.
Idaho’s median download speed was only 43.97 Mbps, despite an average monthly payment of $127.27 in that dataset.
Compare that with New Jersey, where average payments reached $93.50 but median download speeds measured 201.80 Mbps.
Idaho looks perfectly ordinary in the earlier monthly plan-price rankings. Add download speeds, and suddenly that internet bill starts looking considerably less attractive.
One methodological distinction matters here. The state ranking measures advertised residential plan prices, while the speed-adjusted study uses a separate plan database and measured download speeds.
Consequently, their monthly dollar figures aren’t directly interchangeable.
Why Home Internet Prices Vary So Much Across America
Three factors help explain why Americans encounter such different internet prices, even when shopping for similar advertised speeds.
Competition Between Internet Providers
Households with several available providers generally have more opportunities to compare prices and switch plans.
Competition can pressure companies to offer promotional discounts, faster connections, or better terms.
Customers living in areas with only one practical high-speed provider have considerably less negotiating power.
Some places are genuinely expensive to connect. Others simply lack enough competition to make affordable pricing a priority.
Geography and Infrastructure Costs

Building broadband networks across densely populated neighborhoods is generally more economical per household than extending connections across isolated rural communities.
Remote infrastructure can involve expensive construction, maintenance, and equipment transportation.
Those costs help explain why states such as Alaska face substantial pricing disadvantages.
However, geography isn’t a complete explanation, as the broader rankings demonstrate.
Connection Type and Technology
Fiber, cable, 5G home internet, DSL, and satellite connections also operate with different infrastructure requirements and performance capabilities.
The growing demand for wireless connectivity is also driving data consumption across the country. Americans used 159.3 trillion megabytes of wireless data in 2025, marking a 20% increase from the previous year.
Typical 2026 monthly pricing ranges show just how much technology can influence household costs.
| Connection Type | Typical Monthly Cost |
|---|---|
| Fiber | $35–$55 |
| Cable | $30–$85 |
| 5G home internet | $50–$80 |
| DSL | $40–$60 |
| Satellite (Starlink) | $55–$130 |
Fiber can deliver excellent speeds at competitive prices, although availability varies considerably by location.
Cable offers widespread coverage but can become more expensive after promotional discounts expire.
Satellite provides an important alternative for remote properties, although equipment costs and higher monthly rates can make it less attractive in areas with wired connections.
Ultimately, even the cheapest advertised package means little if that connection isn’t available at a customer’s address.
Will Americans Pay More for Home Internet After 2026?
Recent pricing data suggests that internet bills could face continued upward pressure, although faster connections complicate the picture. That represents an additional $17.10 every month, or $205.20 annually.
However, median download speeds also increased 36%, climbing to 116.34 Mbps in 2026 compared with 85.45 Mbps in 2024.
Consumers are paying more in that dataset, but they’re also receiving faster connections on average.
Expanding fiber networks and 5G home internet coverage could eventually create additional competition in markets currently controlled by a limited number of providers.
Lower prices aren’t guaranteed, though. Providers might compete by offering faster packages rather than reducing monthly bills.
My guess is that this distinction becomes increasingly important over the next few years, particularly as households question how much speed they actually need.
America’s Internet Price Gap Isn’t Going Away Overnight
A $533.40 annual difference between New Jersey and Alaska demonstrates how dramatically home internet costs can vary across America.
Yet monthly pricing alone doesn’t determine a good deal. Download speeds, infrastructure availability, and local competition all influence what households receive for their money.
With faster networks expanding and competing technologies improving, consumers could gain more options over the coming years.
America’s internet connections are getting faster. Seeing monthly bills move in the opposite direction would be an even more welcome upgrade.
Figures reflect the sources and time periods cited in this story. It is general information, not financial or investment advice.